

Office tenants looking outside a downtown core usually wonder how far they have to go before the rent drops enough to justify the move, and the answer depends heavily on the market.
To see where the suburban discount shows up, we followed office listings from the core outward across four U.S. metros using Realmo, a CRE intelligence platform combined with a free nationwide commercial real estate marketplace. We checked the same office category, comparing listing counts, available square footage, and asking rates at each stop along the way.
In the office listings we reviewed, moving roughly ten miles from the core cut average asking rates by about 40% in one metro. Elsewhere, going much farther produced a considerably smaller discount. And sometimes the rate went back up as we moved outward.
The Rules of Our Core-to-Suburb Test
The figures used here were checked on September 21, 2026, using Realmo’s Office Spaces for lease pages. For each stop, we recorded the live listing count, displayed office inventory, average asking rate, plus rate band.
All prices are asking rates, not rents from completed transactions. Where a page mixed incompatible rate units, we excluded the average rather than trying to normalize it. We also left out square-footage totals when the displayed roll-up was clearly implausible.
The same category route was used throughout so that an office count in Cambridge meant the same thing as one in Aurora or Plano. We didn’t bring in competitor platforms to see how far Realmo’s office inventory and asking rates could be followed from each core into the surrounding market.
Boston: The Discount Appears, Then Disappears
Boston’s suburban discount works, that is, until you keep driving
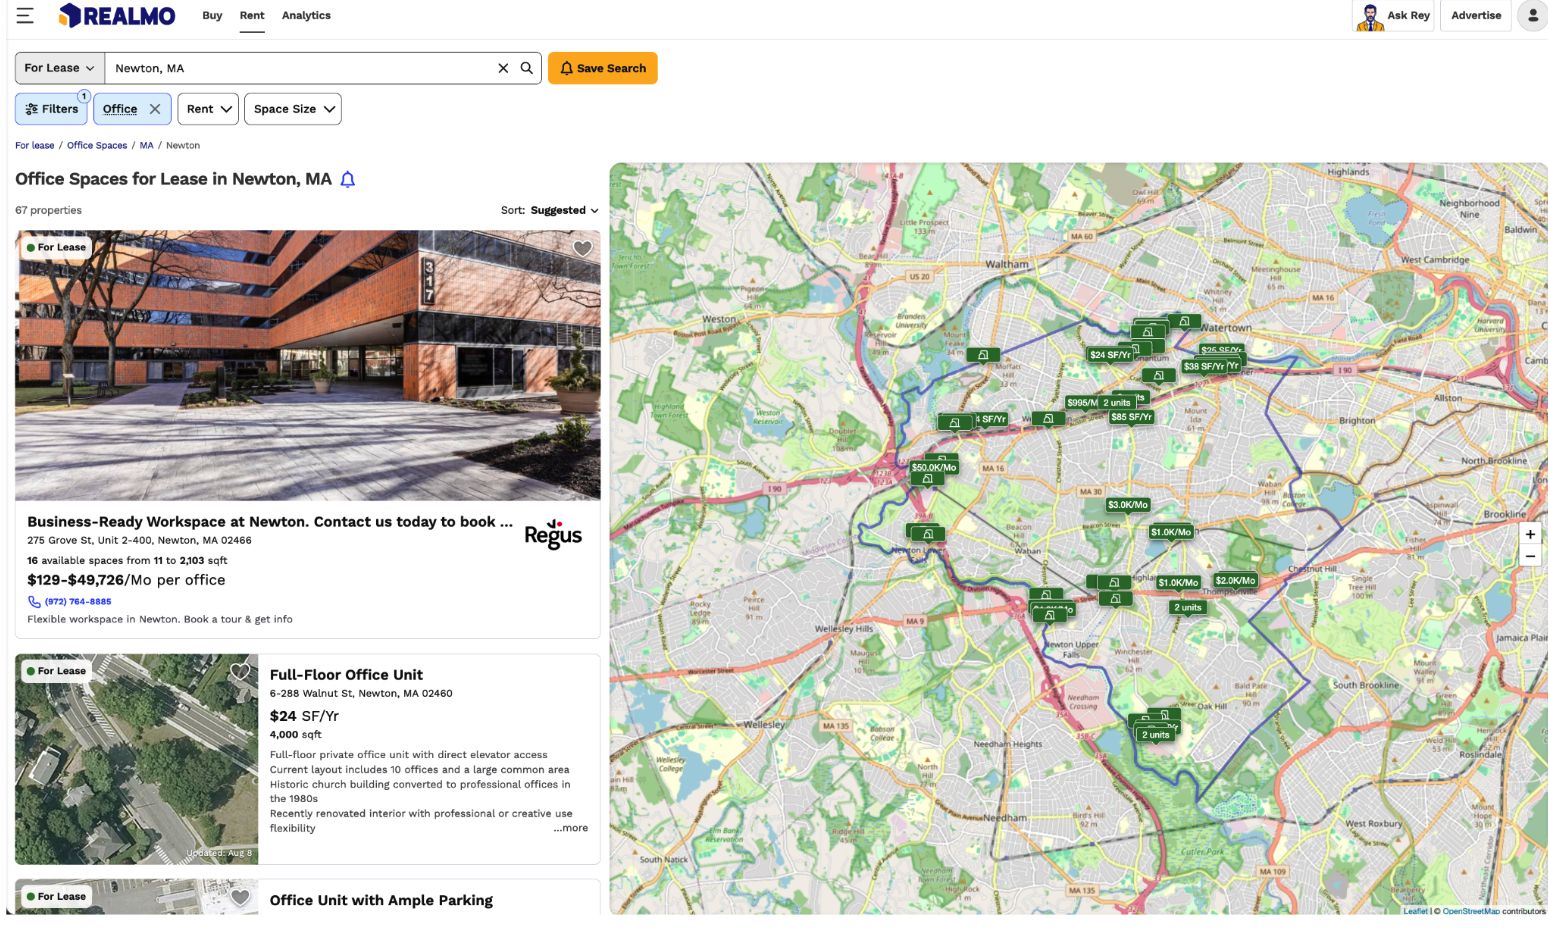
If you start in Cambridge, 128 office listings average $41.78/SF/Yr. Move out to Newton and the average drops to $31.51 across 67 listings. In Waltham, it falls again to $25.38 across 88 listings, which puts it 39% below Cambridge.
For a tenant looking for 2,000 SF, the difference is easy to see in dollars. At the average asking rate, this footprint would run about $83,560 a year in Cambridge and $50,760 in Waltham. Now you’re looking at a gap of $32,800 before negotiations, concessions, or other lease costs.
Then the neat progression breaks, however. Belmont, averaging $30.63/SF/Yr, is closer to the core than Waltham, yet more expensive. It’s also a tiny office market from what we’ve seen. Realmo shows just 13 listings totaling 35,500 SF, compared with Waltham’s 88 listings and nearly 2.7 million SF. A lower listing count also means fewer chances that the right suite, lease structure, and building will line up at the same time.
As you go farther out to Marlborough, the idea of rent steadily falling with distance collapses altogether. Its 32 listings average $60/SF/Yr, with the displayed band also sitting at exactly $60. With no variation in listed rates, $60 may not represent the wider Marlborough market.
Sherborn is even thinner. Realmo showed only two office listings totaling 11,000 SF and no average asking rate.

So Boston does have a substantial suburban discount, which Cambridge-to-Waltham demonstrated. But it’s obviously not the distance alone that produces it. The deeper suburban office market in Waltham gives tenants both a lower average asking rate and considerably more inventory than the smaller towns around it.
Chicago: 28 Miles Buys a Smaller Discount
The move looks very different around Chicago. Downtown has 209 office listings averaging $24.30/SF/Yr. About 28 miles away, Naperville has 69 listings averaging $19.65. That’s a 19% drop, less than half the percentage difference between Cambridge and Waltham.

Naperville’s rate band is also tighter. Listings run from $12.50 to $40/SF/Yr, compared with $8 to $46 downtown. The bottom end is higher, while the top end is lower. For context, the statewide Illinois office average is $22.17, so Naperville is only about 11% below it.
There may also be savings that the asking-rate average doesn’t capture. Some Naperville listings near the Metra station are marketed as all-inclusive gross leases, with utilities, CAM, real estate taxes, and internet included. This changes the comparison with a downtown space where you would need to add some of these costs on top of the base rate.
As you can see, a $19.65 average doesn’t tell the whole story. Around Chicago, going 28 miles out cuts the displayed asking rate, but some tenants may benefit from what’s included in the lease more than from a suburban price gap.
Denver Trades Choice for Cheaper Rent, Plano Offers Both
If you look into Denver, it resembles the Boston pattern. Downtown Denver has 174 office listings averaging $30.10/SF/Yr. About ten miles east, Aurora averages $17.75 across 47 listings. That’s a 41% drop, the largest core-to-suburb discount in our four-market check.
However, Aurora has far less office space to choose from. Downtown has nearly 5.2 million SF of displayed office inventory, while Aurora has about 459,000 SF. Aurora’s asking rates are also within a much narrower $12–$24/SF/Yr band, compared with $1.69–$42 downtown. Ten miles can save a lot on the asking rate, but it also leaves a tenant with a smaller pool.
Dallas works differently. Downtown Dallas averages $32.19/SF/Yr across 82 listings. Plano, roughly 20 miles north, has 202 listings averaging $24.62, which is a 23.5% discount with more than twice as many listings. Plano also has about 5.6 million SF of displayed inventory, versus roughly 3.9 million downtown.

If you widen the comparison, though, the discount nearly vanishes. Across Dallas, 651 office listings average $23.84/SF/Yr, slightly below Plano.
Together, the two markets show why the suburban label means little on its own. Aurora offers a steep rate cut with much less inventory. Plano is a major office market in its own right and cheaper than the downtown core, but priced almost exactly like Dallas office space overall.
Why the Suburban Office Discount Goes Beyond Asking Rent
A 20%, 30%, or 40% gap in asking rates doesn’t translate directly into the same reduction in occupancy costs. Lease structure can change the real occupancy cost pretty dramatically. A full-service or gross lease may include:
- CAM
- Real estate taxes
- Insurance
- Sometimes utilities
Under a triple net (NNN) lease, some of those expenses are charged separately. A $25/SF/Yr gross quote and a $25 base rate under NNN terms are not equivalent.
The averages can also hide very different pools of available space. Naperville’s $12.50–$40 band is much narrower than Downtown Chicago’s $8–$46. A very low floor can come from:
- An odd listing
- A sublease
- Space with conditions that make it irrelevant to most tenants
Looking at the whole band helps you show how much variation is there behind the average.
The type and size of the office can shift the price further. Class A and Class B buildings, older properties, divisible space, and smaller suites can carry very different rates. Tenants also need to compare usable and rentable square feet because circulation and common-area factors can leave two nominally identical 4,000-SF leases with different amounts of space employees can use. A rough planning benchmark is 150–175 SF per employee.
Finally, compare the lease over its full term. A 2–3% annual escalation compounds from the starting rent, so a lower base rate keeps affecting the bill long after any tenant improvement allowance or other upfront concession is spent.
Where the Suburban Office Discount Starts to Cost You
You might have already realized that cheaper rent can leave you with fewer viable offices. Belmont had only 13 listings when we checked, and Sherborn had two. In such cases, searching one town may be too restrictive. If you need a specific size, building class, or lease type, you may have to widen the search to neighboring towns.
The commute can narrow the options again. Suburban offices tend to work better for employees who drive, so check commuter rail and bus connections before treating the rent difference as savings. Drive time during commuting hours deserves the same attention as mileage.
Remember that location also carries a business cost. A client-facing firm may save on rent and still lose money if the move makes meetings harder or pushes employees to leave. These costs would never appear in the asking rate yet they’re very real.
There are also limits to what we can conclude from Realmo’s data. Rate units aren’t always normalized across results: $/SF/Yr, monthly rates, and “contact for pricing” can appear together. Some header square-footage totals are unreliable, and unusually low rate floors may come from listings that aren’t realistic options for most tenants. We excluded questionable figures from this analysis.
Measure the suburban discount against all of these costs before deciding how far out to search.
When to Take the Suburban Discount
It’s a good idea to start looking outward when the gap is large enough to change the annual occupancy budget. In our review, a 2,000-SF office at Cambridge’s average asking rate costs about $32,800 more per year than the same footprint at Waltham’s average. Downtown Denver versus Aurora produces a difference of about $24,700. That’s the kind of numbers worth putting against the cost of a longer commute.
Of course, a smaller gap requires closer scrutiny. Downtown Chicago to Naperville saves about $9,300 a year on 2,000 SF at the displayed averages. Beyond the rate, this decision to move may depend more on:
- Lease terms
- Transit
- Available suites
Be especially careful when the suburban market has only a handful of listings. A low average means little if none of these offices fits your space requirement or location needs. The same applies when the suburb is already a major office market. Plano has more than twice as many listings as Downtown Dallas and averages 23.5% less, but its rate is slightly above Dallas overall.
Run the Suburban Discount Test in Your Market
You can run the same check without building a complicated market model. Pick your downtown core, then choose three office markets at increasing distances from it. Open the same office-for-lease category on Realmo for each and record:
- The listing count
- Asking-rate average
- Rate range
- Available square footage
Open the listings that could realistically fit your business and check the lease type, suite size, usable versus rentable square footage, annual escalations, and any tenant improvement allowance. Convert every quote to the same unit before comparing them. Then put the annual savings in dollars. A 20% discount sounds substantial, but depending on the space you need, it may or may not pay for the longer commute and smaller selection.
Once you’ve run the core-to-suburb search on Realmo’s office marketplace, then confirm that any property you’re considering is still available before contacting the broker.